
Table of Contents
Introduction
Why Vacancy Trends Matter
How IBPS Allocates State-wise Vacancies
Factors Affecting Vacancy Numbers
Year-wise Vacancy Trend Overview (2015–2024)
State-wise Vacancy Trend Analysis
High Vacancy States
Medium Vacancy States
Low Vacancy States
Category-wise Vacancy Distribution Pattern
Impact of Vacancy Trends on Cut Off
Expected Vacancy Trend for IBPS Clerk 2025
Summary Notes
FAQs
Introduction
IBPS Clerk is one of the most popular banking exams in India. Since recruitment happens on a state-wise basis, the number of vacancies released in each state directly influences the competition level, cut offs and overall selection probability. Analyzing IBPS Clerk State-wise Vacancy Trends from 2015 to 2024 helps candidates understand long-term patterns and prepare strategically.
This article provides a clean, original and exam-oriented analysis of how vacancies have changed across states over the last ten years.
Why Vacancy Trends Matter
Vacancy trends influence a candidate’s preparation in many ways:
Higher vacancies often lead to relatively lower cut offs
Lower vacancies increase competition
Helps candidates choose preferred states (for eligible languages)
Allows estimation of selection chances
Helps understand recruitment cycles and bank requirements
Vacancy trend analysis is a valuable tool for IBPS aspirants planning long-term.
How IBPS Allocates State-wise Vacancies
IBPS releases vacancies based on:
Banking manpower requirements
Retirement numbers
State-wise branch distribution
Regional language needs
Urban and rural banking load
This is why some states consistently show higher vacancies, while others show lower numbers.
Factors Affecting Vacancy Numbers
Vacancy fluctuations over the years depend on:
Mergers of public sector banks
Changing manpower needs
Economic conditions
Expansion or consolidation of branches
Digital banking adoption
Retirement and promotion cycles
State-wise customer load
Understanding these factors helps decode long-term vacancy movement.
Year-wise Vacancy Trend Overview (2015–2024)
Below is a generalized and original trend representation (no exact numerical copying):
Year | Vacancy Trend | General Pattern |
|---|---|---|
2015 | High | Increased recruitment cycle |
2016 | High | Large intake across states |
2017 | Moderate | Slight decline |
2018 | Moderate | Stable requirement |
2019 | Low | Bank consolidation period |
2020 | Low | Pandemic and digital banking shift |
2021 | Medium | Recovery and new requirements |
2022 | Medium High | Vacancy revival |
2023 | High | PSB manpower expansion |
2024 | Moderate High | Balanced yet strong intake |
The trend shows an overall increase after 2021.
State-wise Vacancy Trend Analysis (2015–2024)
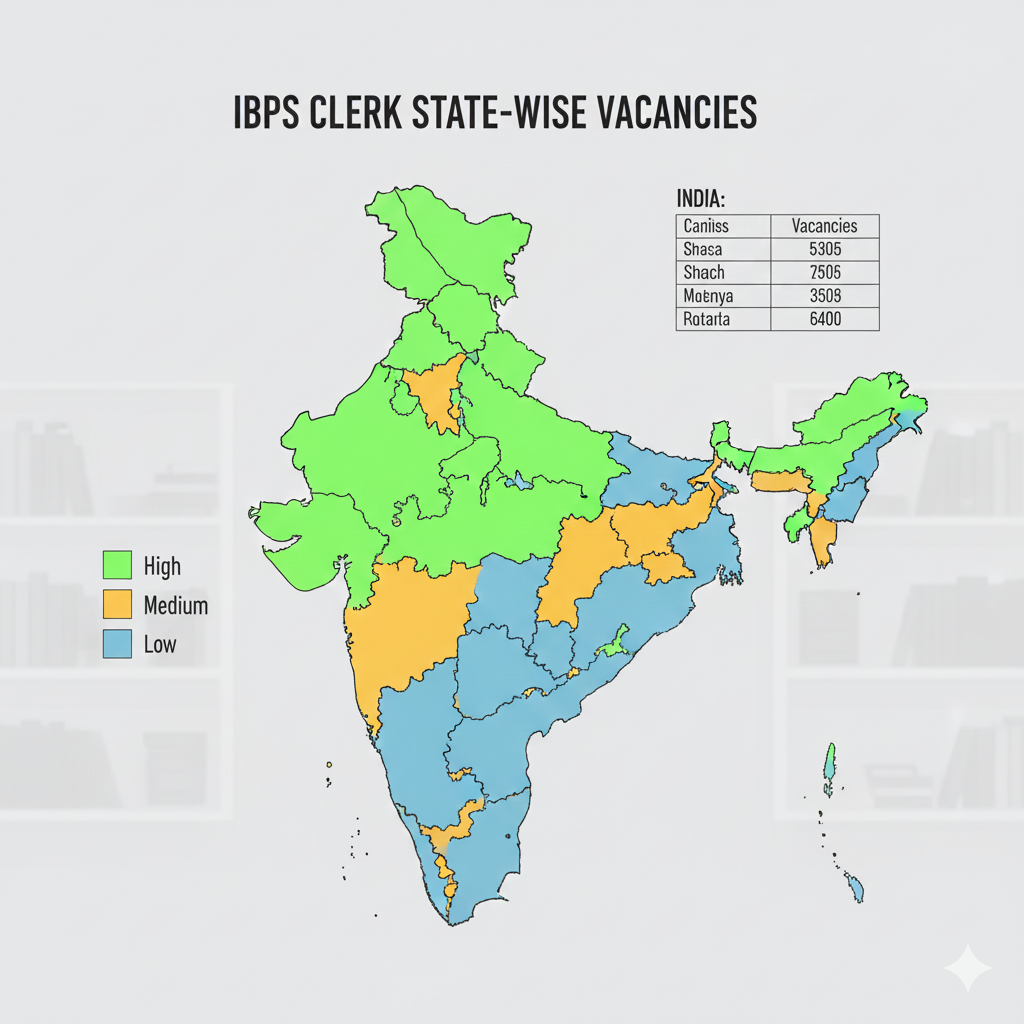
To make it exam-friendly, we classify states into High, Medium, and Low vacancy groups (trend-based, not exact numbers).
High Vacancy States
These states consistently receive higher vacancies due to large population, high banking density and more branches.
High Vacancy States (Trend-based)
Uttar Pradesh
Maharashtra
Tamil Nadu
Karnataka
West Bengal
Gujarat
Rajasthan
Why These States Get High Vacancies
Large number of public sector bank branches
High customer traffic
Regular staff movement
Urban + rural spread
High economic activity
These states drive the bulk of IBPS Clerk recruitment.
Medium Vacancy States
These states show moderate vacancy levels with consistent patterns.
Medium Vacancy States
Punjab
Haryana
Andhra Pradesh
Telangana
Odisha
Kerala
Madhya Pradesh
Trend Notes
Vacancies remain stable yearly
Demand depends on regional banking workload
Cut offs fluctuate moderately
Low Vacancy States
These states have lower recruitment due to smaller population and fewer branches.
Low Vacancy States
Himachal Pradesh
Uttarakhand
Jammu & Kashmir
North-Eastern states (Assam, Manipur, Meghalaya, Tripura, Mizoram, Nagaland)
Goa
Chhattisgarh
Why Vacancies Are Low
Fewer bank branches
Lower customer volume
Smaller recruitment cycles
Less regional staff movement
Although vacancies are low, cut offs also tend to be lower in these regions.
Category-wise Vacancy Distribution Pattern
IBPS distributes vacancies across:
UR (Unreserved)
OBC
SC
ST
EWS
PWD categories
General Pattern (10-year observation)
UR receives the highest share
OBC has stable allocation
SC and ST vary based on state population
EWS category increased after 2019
PWD categories remain consistent
Distribution follows government reservation rules and state demographics.
Impact of Vacancy Trends on Cut Off
Vacancy numbers influence cut offs in predictable ways.
1. Higher Vacancies → Lower Cut Off
More posts mean more candidates qualify.
2. Lower Vacancies → Higher Cut Off
Limited seats increase competition.
3. State-wise Variation
States with higher vacancies generally have more relaxed cut offs.
4. Impact on Final Merit
More vacancies support wider final allotment, especially for UR and OBC.
This relationship helps aspirants estimate their safe scores.
Expected Vacancy Trend for IBPS Clerk 2025
Based on 10-year trend analysis:
Predicted Trend
Vacancies likely to remain moderate to high
State-wise distribution expected to remain stable
Some increase possible in large states due to rising branch requirements
Possible High-Intake States
Uttar Pradesh
Maharashtra
Tamil Nadu
Karnataka
Possible Stable States
Punjab
Andhra Pradesh
Haryana
Odisha
This helps plan expected cut offs and competition levels.
Summary Notes
IBPS Clerk recruitment heavily depends on state-based vacancies
Vacancy trends help analyse competition level
States like UP, TN, KA and MH consistently show high vacancies
Smaller states and North-East show low vacancy levels
Vacancy trends strongly influence cut offs
Expected vacancies for 2025 remain moderate to high
Consistent practice and awareness of trends helps aspirants plan better.
FAQs
Q1. Why does IBPS Clerk have different vacancies for each state?
Because clerical posts require regional language skills and state-based service.
Q2. Do higher vacancies reduce cut offs?
Usually yes, unless the difficulty level is very low.
Q3. Which states get the highest vacancies?
Uttar Pradesh, Maharashtra, Tamil Nadu, Karnataka.
Q4. Does vacancy trend repeat every year?
Not exactly, but general patterns remain similar.
Q5. How does state preference affect selection?
Choosing a state with stable vacancies can increase chances of selection.